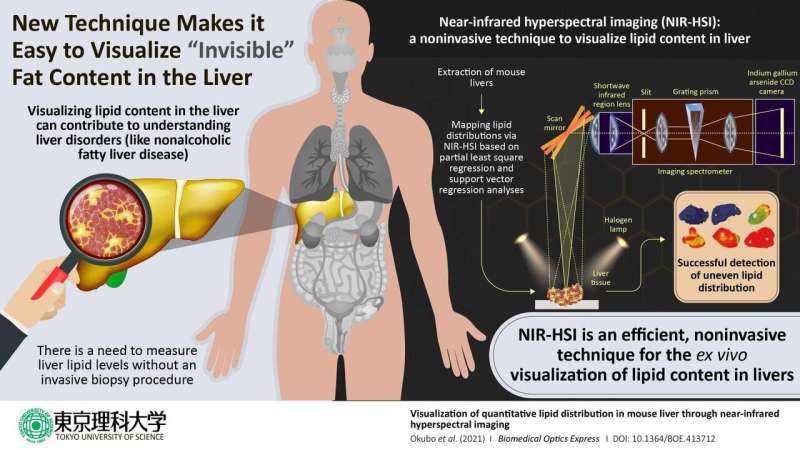
Nonalcoholic fatty liver disease (NAFLD) is a pathological condition characterized by excessive fat stored in the liver that is not attributed to heavy alcohol consumption, which can lead to liver failure and even cancer. Obesity, type 2 diabetes, and high cholesterol levels are all risk factors for this disease, and like the global prevalence of obesity, the prevalence of NAFLD is coincidently expected to rise as well.
It is therefore critical for clinicians to handle effective tools for diagnosing NAFLD. The current standard method for diagnosis is analysis of liver biopsy samples. However, this approach has shortcomings such as invasiveness and the potential for sampling errors, so there is a pressing need for reliable noninvasive methods. In a new study published in the journal Biomedical Optics Express, a team of researchers, led by Professor Kohei Soga of Tokyo University of Science including Assistant Professor Kyohei Okubo of Tokyo University of Science and Professor Naoko Ohtani of Osaka City University, reports the successful use of near-infrared hyperspectral imaging to quantitatively analyze the distributions of lipids (a class of lipids commonly found in fat) in mouse liver. Dr. Okubo says, “Lipid distribution in the liver provides crucial information for diagnosing fatty liver-associated liver diseases including cancer, and therefore, a noninvasive, label-free, quantitative modality is needed.”
In describing the inspiration for this project, Dr. Okubo collaborated with Professor Ohtani, who studies the relationship between obesity and liver disease. Given the success of other research groups in using near-infrared hyperspectral imaging to visualize plaques in rabbit blood vessels and fatty acids in pork meats, Prof. Soga’s team decided to try using it to visualize the distribution of lipids in mouse liver.
The study focused on mice that were either on a normal diet or one of three kinds of high-fat diets rich in various types of lipids. The objective of these varied diets was to generate a set of livers with diverse lipid profiles. After extracting the livers, the scientists used a reference test to generate convincing results for comparing their hyperspectral imaging results. They used the Folch extraction method to isolate lipids from small pieces of the livers and then weighed the isolated lipid samples to calculate the total weight of lipids within the livers. The scientists next performed near-infrared hyperspectral imaging and used two candidate data analysis methods—partial least-square regression and support vector regression—to quantitatively visualize lipid distributions within the liver to identify the better analytical method.
When the scientists examined their data, they found that it enabled them to image the livers in gradient colors according to the lipid levels contained in the livers and to generate maps of the local lipid densities within the livers. The lipid levels as measured with hyperspectral imaging closely correlated with the actual lipid levels as quantified based on Folch extraction method, and this correlation was stronger in the lipid levels calculated using support vector regression than for the lipid levels calculated using partial least square regression.
Source: Read Full Article