
Dr. T. Diefenbach in his zoom webinar discusses the work he and his colleagues conducted at the Ragon Insitute in Boston where the dynamics of B and T cell populations from post-mortem COVID -19 patients' lymph nodes were analyzed using microscopy and image analysis techniques. This interview for News-Medical is the transcript of the online webinar.
Could you start by providing our readers a brief overview of your research?
The collaborative work of Dr. Shiv Pillai's laboratory at the Ragon Institute of MGH, MIT and Harvard focused on examining the dynamics of B and T cell populations in lymph nodes from post-mortem patients infected with COVID-19. My collaborative role in this research was in developing and implementing microscopy and image analysis techniques using methods and instrumentation in part supplied by TissueGnostics.
This research was published in August of 2020 by Dr. Naoki Kaneko et al.. It was a landmark paper insofar as it was the first to examine at the single cell level the structure of germinal centers in lymph nodes and the spleen of COVID-19 patients.
The group here investigated biopsies obtained from post-mortem patients from Brigham Women’s Hospital in Boston. These patients fell into two categories: some of them had passed away early (within about ten days of contracting COVID-19), and the remainder had shown progression to between 15/36 days before they passed on.
These samples provided an interesting opportunity to examine the distribution of different T cells and B cell populations within lymph nodes in the context of COVID-19 infection. It was also of interest to investigate the structure of lymph nodes microscopically in a way that revealed something about how the infection alters the tissue distribution of cells and, therefore, potentially impact the strength and duration of the immune response.
What criteria did you develop to qualify or categorize the strength of the immune response?
During an infection, coordinated activation of B and T cells leads to stimulation of germinal center formation through activity of T follicular helper cells, accompanied by Bcl-6-positive B cells populating the germinal center interior.
There were 17 patients in total who were positive for COVID-19, and our investigation focused on distinct Bcl-6+ T and B cell populations compared to control patients that had passed away from other causes.
Early on in the course of the COVID-19 infection, we were surprised to find that the germinal centers were visibly disrupted in both lymph nodes, both in terms of an absence of Bcl-6+ T follicular helper cell (TFH) differentiation, and in terms of an accompanying reduction in Bcl-6+ B germinal center B cells. These reductions were associated with an increase in TH17 CD4+ T cells, implicating an indirect relationship between increased TH17 cells and reduced TFH and Bcl-6 B cell numbers. In contrast to the significant reduction in CD19-positive B cells, CD3+ T-cells showed less of a reduction. These changes were also correlated in patients showing more severe inflammation (as indicated by blood CRP levels).
The effect of COVID-19 infection on Bcl-6 positive B cells in lymph nodes was also observed in the spleen, with spleen B cells showing similar trends in terms of cell number reductions. These results together suggested a possible contributing mechanism by which long-term humoral immunity might be impaired.
Please could you summarize the equipment and analysis methodology you used to make these discoveries?
Several years ago, we obtained a TissueFAXS slide scanner. This automated slide scanner is equipped with a motorized stage that can scan up to eight slides at a time. We coupled this scanner with a Lumencor Spectra X light engine, which is a light source with six excitation LEDs (light-emitting diodes).
To this light engine I also added a custom LED to provide a 750 nm excitation (near IR) channel. The system was coupled with a Hamamatsu Orca Flash 4 camera as I found it has sufficient spectral sensitivity in the far red of the emission spectrum, meaning we could add far red fluorophores like Alexa Fluor 750 (AF750) quite easily for an additional color channel.
In total the custom filter sets combined with the additional LEDs provided us with 8-10 color channels (fluorescent markers) compared to the typical four (DAPI/FITC/Rhod/Cy5) found on most fluorescence microscopes.
Using this customized color imaging system coupled with the slide scanner, we were able to obtain individual fields of view and stitch them together into one large single image to observe entire regions of tissue, much like a spatial map analogous to a Google Earth view showing how the different cell populations are distributed over large areas throughout the tissue sections.
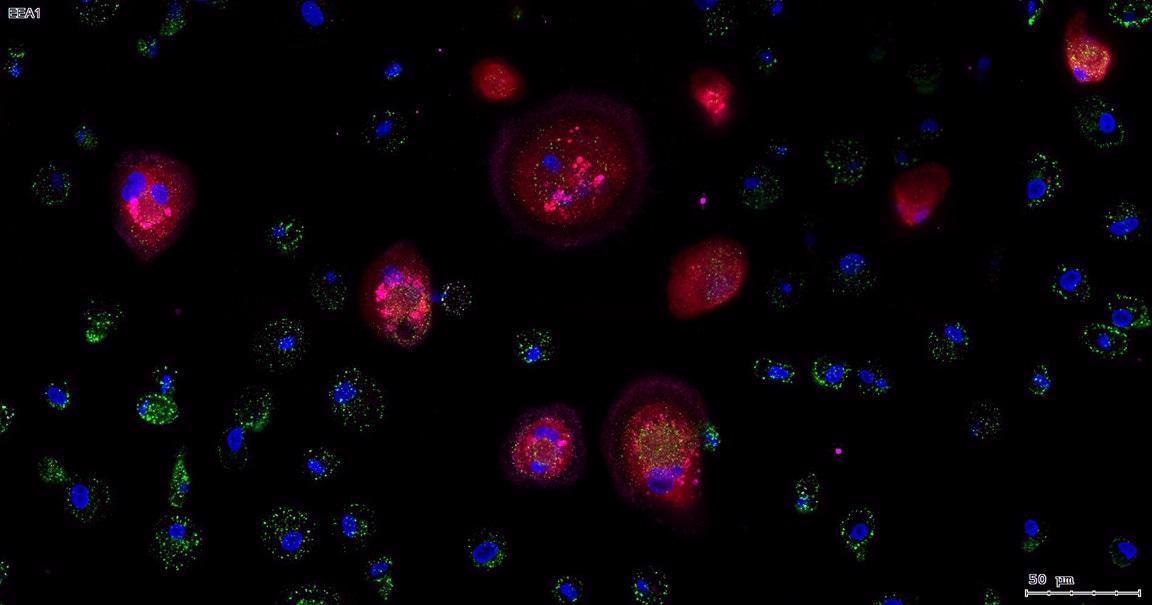
Image Credit: Dr. T. Diefenbach
How has this setup evolved since its initial implementation?
Since our group employs flow cytometry extensively in the investigation of human blood and tissue biopsy samples, we are often working with 15-28 color marker interrogations of cells, including B cells, T cells, macrophages, NK cells, dendritic cells and so on. Thus, I wanted to further improve the ability of our microscopy approaches to match the color channel flexibility of flow cytometry, and in particular, for our slide scanner to be able to interrogate similar numbers of markers (color channels).
I therefore adopted a more powerful and flexible Spectra 3 light engine from Lumencor so that instead of only six LEDs, we employed eight LEDs, with each excitation channel utlizing 500 mW of power (significantly more than, for example, the lasers on a confocal microscope). This permitted me to further expand the palette of colors that could be utlizied to address cellular markers in tissue.
The improved system incorporates three different imaging modalities and cameras. One camera (a black and white camera) is used for regular epifluorescence imaging with fixed filter sets, a second color camera is employed for white light histological imaging, and the third camera is specialized for multispectral imaging using a tunable LCD. Multispectral imaging involves sampling the fluorescence emissions from the tissue sample in 10 nm increments over a range of 420 to 720 nm to spectrally "profile" the emission curves, and with analysis software, to mathematically "unmix" those overlapping emission curves, so that the individual channels are separated from each other clearly from the original "mix" of color channels (spectral curves).
I was thus able to spectrally profile individual fluorophores in what is called a "Lambda stack" approach with the help of the StrataQuest software to isolate the individual and often over-lapping channels from multiplex-stained tissue, resulting in the ability to observe more cellular markers in tissue and therefore the interactions of those cells in terms of their distributions and contacts.
With this system in place, and with the TissueFAXS image capture software, we were able to observe and separate eight color channels. Our current workflow also permits the separation of many more, even unlimited, color channels through an iterative approach to staining and imaging, and our future goal is to routinely image 28 markers in tissue.
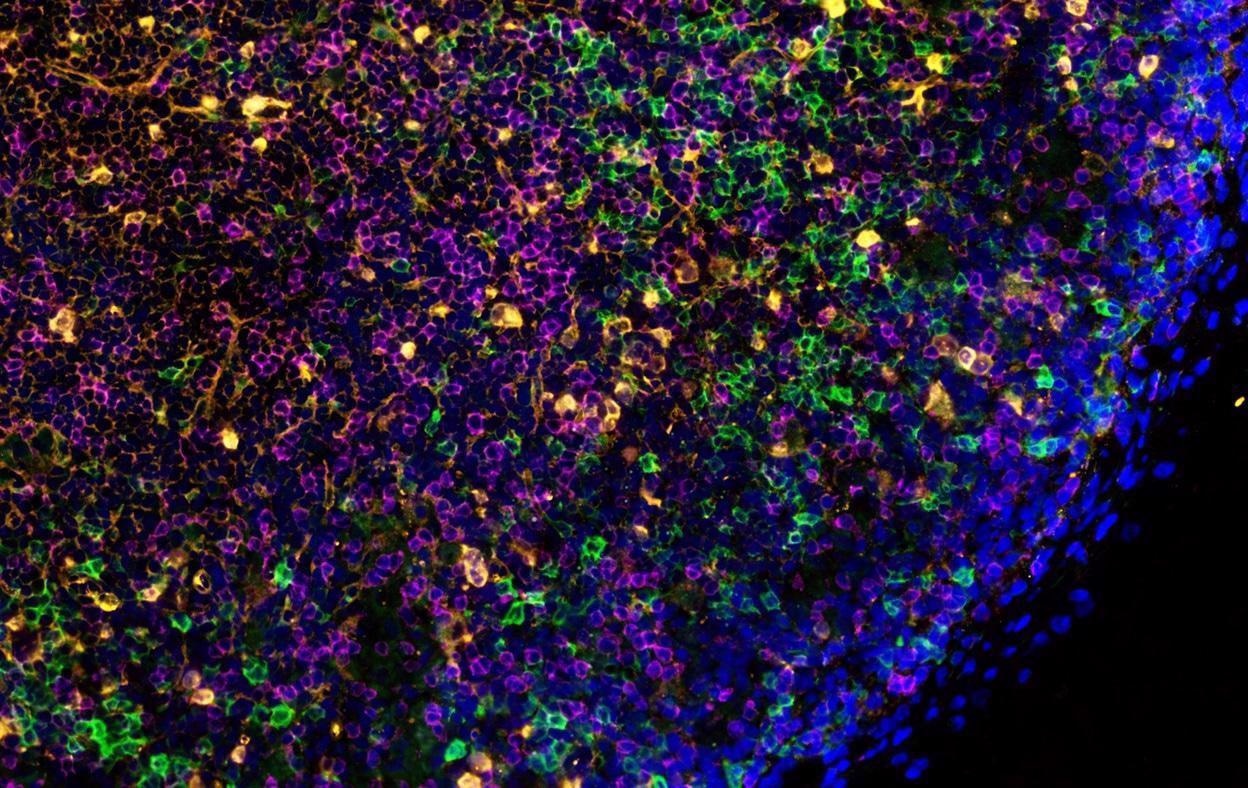
Image Credit: Dr. T. Diefenbach
What other advantages did the ability to image more colors offer to the analysis of lymph node samples?
When we observe a raw, unmixed multispectral image sample – an image that we captured across eight colors – and try to work with this, it has limited use since the color channels are too obscured by spectral overlap.
Thus, profiling the emission of a sample region across the full spectrum and analyzing this with the StrataQuest software interface permitted us to isolate each channel and divide it into its constituent 10-nanometer intervals or bins.
Having that 10 nm resolution also permits us to define the wavelength range over which we are sampling a tissue region. This is helpful in terms of examining regions of interest (ie: background fluorescence, autofluorescence intrinsic to the tissue, in addition to regions with specific immunofluorescence), and we can then use these small "test" regions to refine different analysis parameters, apply those parameters across large tissue regions, or unmix the different channels at the single cell and tissue levels.
For example, if we are examining an eight-color immunostained tissue, we would need eight single-stained controls for each of the fluorophores. Using the StrataQuest software, we can create and store those single staining profiles in a database, including the autofluorescence and background fluorescence, as separate channels. The software will use these stored profiles to build a spectral map of the emission signatures and then mathematically unmix them, yielding pure and isolated fluorescence signals.
One of the benefits of this process and this approach is that we can conceivably look at more than eight fluorescent markers – to even 10, 20, 30 or even more markers. There is essentially an unlimited number of markers we could look at with a technique whereby one can immunostain, image the sample, and then wash off or bleach the markers, then re-stain, image, and repeat, all in a slide-scanning format.
One approach is to utilize washable dyes, or using Tyramide signal amplification (TSA) which permits multiplexing (repeated staining and dye removal protocols).
How does the use of removable markers help to improve imaging and analysis of cells in COVID-19 patients? How does the StrataQuest software help in this process?
By using these removable markers (removed using washing, bleaching or microwaving) in these repetitive rounds of staining and imaging, we can build up a spatial map of cell populations in specific and spatially relevant tissue regions. Each single round of scanning could employ anywhere from 8 markers (no spectral unmixing) to 10 or more (with spectral unmixing).
Although, in using such an interative multiplexed approach, one does not necessarily need a multispectral imaging system. Instead, one can simply use a regular epifluorescence microscope and multiplexed markers to repeat the stain/image/wash process and sequentially build a spatial marker map. Whatever the goal might be, we have found the StrataQuest software to possess the flexibility in terms of being able to incorporate markers and emission profiles utilizing either multiplexing or spectral unmixing.
As part of building the spectral map, we employ within the StrataQuest software an addition tool referred to as "cross correlation" or a technique of tissue registration which precisely aligns separate scans of the same tissue section in xy space. For example, we may have a scan with a specific marker set A, and then we can do another stain of the same tissue section with a marker set B, and perform a second scan of that same tissue, and then we are able to combine the two marker A and B scan sets in the StrataQuest software and align them at the single cell level during the registration process to combine the marker sets in an iterative process.
The software therefore permits one to overlap these images at the single-cell level, building up a map of markers without having to do multispectral imaging, and examining co-localization of numerous cellular markers (such as proteins of interest) in a very efficient manner. Indeed, this approach is amenable even if one has only a single marker such as Alexa Fluor 488 (equivalent to FITC) and wishes to build an iterative marker map.
Multispectral imaging becomes important when dealing with markers such as the Opal dyes, or fluorescent proteins like GFP or mCherry, which have much broader emission profiles and therefore more spectral overlap, or when dealing with the need to profile natural autofluorescence or marker background fluorescence in liver tissue, intestine or colon tissue, or brain tissue. Often such tissues have more autofluorescence in the blue and green parts of the spectrum, so that multispectral imaging permits one to profile that autofluorescence and effectively remove it, leaving only the specific marker fluorescence profiles.
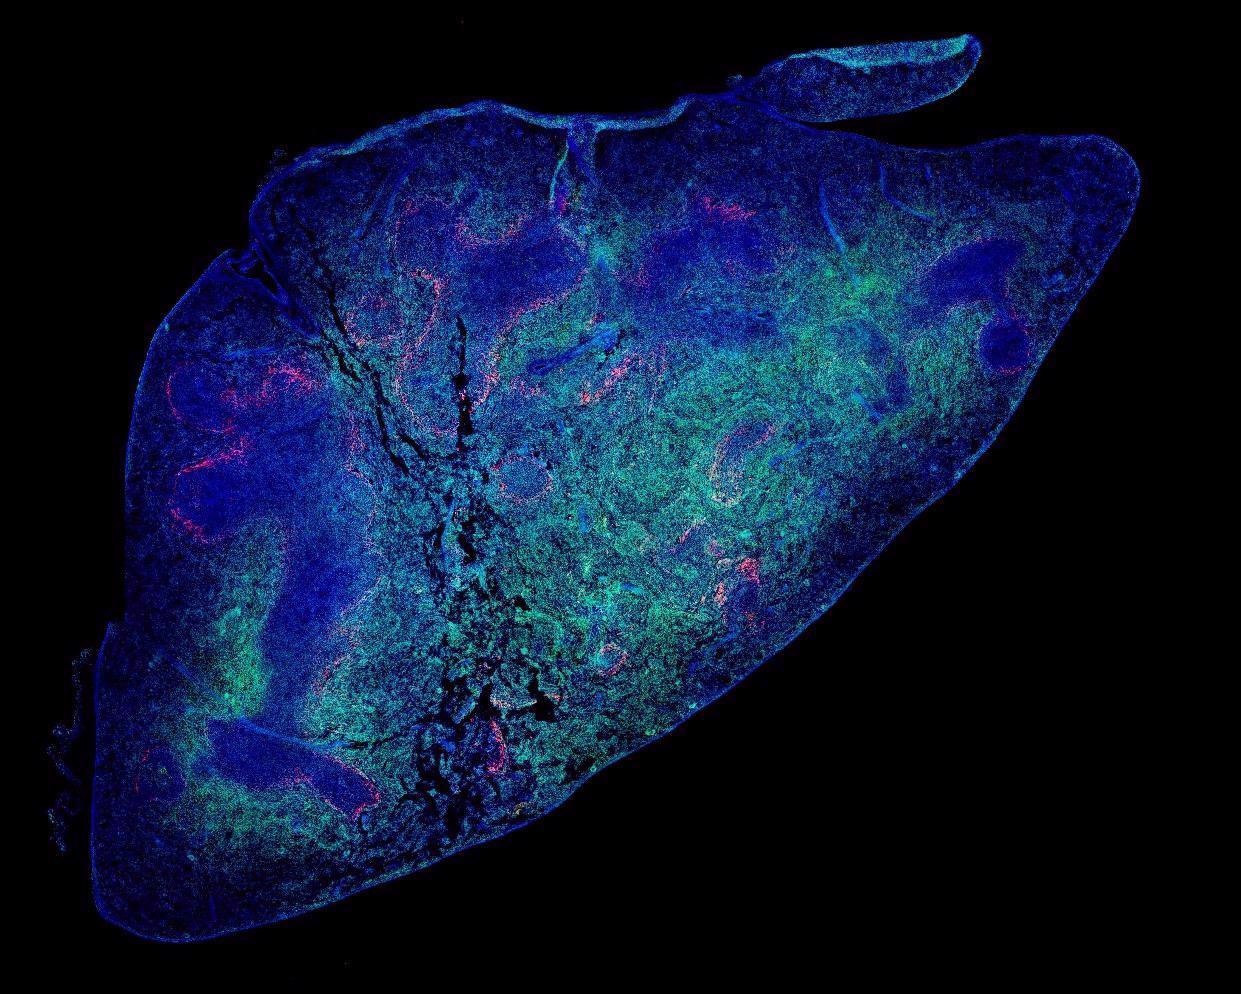
Image Credit: Dr. T. Diefenbach
Where does the use of confocal imaging lie within this instrument setup, and what advantages does this offer?
Another imaging modality that we employ in our study is the spinning disc confocal version of the TissueFAXS slide scanner. A typical confocal microscope can only look at one slide at a time, making it very time-consuming. The TissueFAXS Confocal permits us to look at up to 120 slides at a time and automate the scanning in a high-throughput manner. In addition, each slide can also have its own experimental profile, for example, fluorescence, confocal, brightfield or even 3D stacks in confocal. Confocal imaging utilizes pinholes to isolate the emission of light from a narrow optical section width at the focal plane of the tissue sample, thereby excluding the out-of-focus "blur" from above and below the focal plane that can reduce image contrast and effective resolution.
In addition, I was able to modify the TissueFAXS SQL confocal system to perform automated, high-throughput oil immersion confocal imaging with high numerical aperture objectives such as 63x or 100x, which is often necessary for high-resolution imaging of single cells in culture situations . This is thus a very versatile, efficient and high-throughput imaging platform.
We have used this confocal system to investigate and scan marmoset lymph nodes, generating a 3D z-stack (a sequential set of images captured in the vertical plane) from that tissue session. When looking at the follicles within the lymph nodes, it was apparent that some of these have a polarized or distinct distribution of B cells and T cells, with some cells on one end of the follicle and some on the other. In contrast, follicles that are more centrally located in the lymph nodes have more uniform distributions of B cells and T-cells. This observation, however, was not examined in detail or published by our group, but is known in the literature, and our imaging platform could also be used to characterize such follicles even in an automated way using the StrataQuest software (it can identify cells based on density within the tissue in addition to biomarker localization). The polarized segregation of these cell populations within lymph node follicles suggests cellular dynamics at the population level perhaps subserving a functional relevance that could be examined over the course of an infection.
Typically for imaging on this system, we can automate the scanning of six lymph nodes per slide, for at least 20 slides, and image these overnight. On a typical confocal microscope, this same slide set would take a technician two weeks of work since most confocal systems only permit one slide (tissue section) to be imaged at a time (and then the operator has to physically change the slide and set up another scan).
Such automated high-throughput slide scanning has a wide range of practical applications. There was one instance where we had an investigator looking for a rare type of T cells – essentially one in every ten thousand T cells and thus a very rare phenotype in cell culture. This required the scanning of over 32 million cells overnight in order to obtain a few hundred positive phenotypes, but we were successful in obtaining enough of the rare cells sufficient for analysis.
Another investigator was seeking stem cells in pancreatic islets. Out of 100 eyelets, potentially just one of them might have a single stem cell. Thus, being able to rapidly scan very large tissue regions means we were able to isolate these very rare stem cells and other events that practically in any other way would not be amenable to study.
We have also applied this high resolution automated scanning procedure to cell cultures such as human macrophages that were infected with HIV. Indeed, the primary goal of our institute to develop a vaccine and therapeutic cure for AIDS.
How does one efficiently isolate cells in densely populated tissue for analysis?
To isolate cell populations within tissues, we have to first create separate color channels for the fluorophores (which each have their own unique emission profiles). The software will examine those channels in isolation and create "masks", namely 2D representations of each cell based on its fluorescence intensity. For example, the DAPI (cell nucleus) channel is imaged in black and white initially because we assign color to these channels using the TissueFAXS and StrataQuest software, so that we can look at co-localization (spatial overlap) of cellular markers based on the overlap of fluorescence signal intensities within these masks.
The next stage of the analysis process involves segmentation, for example, to look at first at the nuclei based on DAPI staining to determine the location of individual cells. Then, the software looks radially outwards in the other marker color channels to create additional masks of the cellular cytoplasm around the cell nuclei, and in this way we can profile specific types of cells based on the cytoplasmic masks and their respective intensities in the different color channels.
Once these cells have been segmented, they are defined with respect to each other spatially to further isolate them in densely populated tissue, and then they can be further examined in terms of, for example, the contact of cells with one another in tissue, which provides in fixed tissue a sort of snapshot in time of the dynamics of those cells.
The StrataQuest analysis software we use supports this process by generating scatter plots of the cell "events" or populations based on marker profiles, similar to what one performs during flow cytometry, in which one can isolate double-positive cells (based on marker overlap, or in this case, colocalization) to generate thresholds, or levels above which the average intensity of a fluorescent marker is said to be "positive" or specific to that cell. We can then pick a data point or event, and then the software will backwards gate visually to that cell. We are also able to visually inspect all the cells that are above a particular threshold, and therefore represent part of a "positive" population.
Using such analysis techniques, we can then delineate the boundaries of the cells (the perimeters of the cellular masks), for example, and then quantify how many other cells any given cell might be in contact with at a given time.
Thus, even though we are looking at fixed (preserved) tissue with immobile cells, we are able to create a snapshot or picture of cell-to-cell interactions, and piece together the dynamics of cells over time during an infection (depending on the time after infection the tissue was harvested). As a result, we can also compare regions of tissue that we can either manually or with automated algorithms provided by the software outline in 2D space, and develop applications in StrataQuest to identify tissue structures such as germinal centers based on their cell density or marker profiles. In this way we were able to examine cell-to-cell interactions and compare them both inside germinal centers and in regions adjacent to or outside those centers. This then helps one to build a spatiotemporal map of cell interactions within tissues.
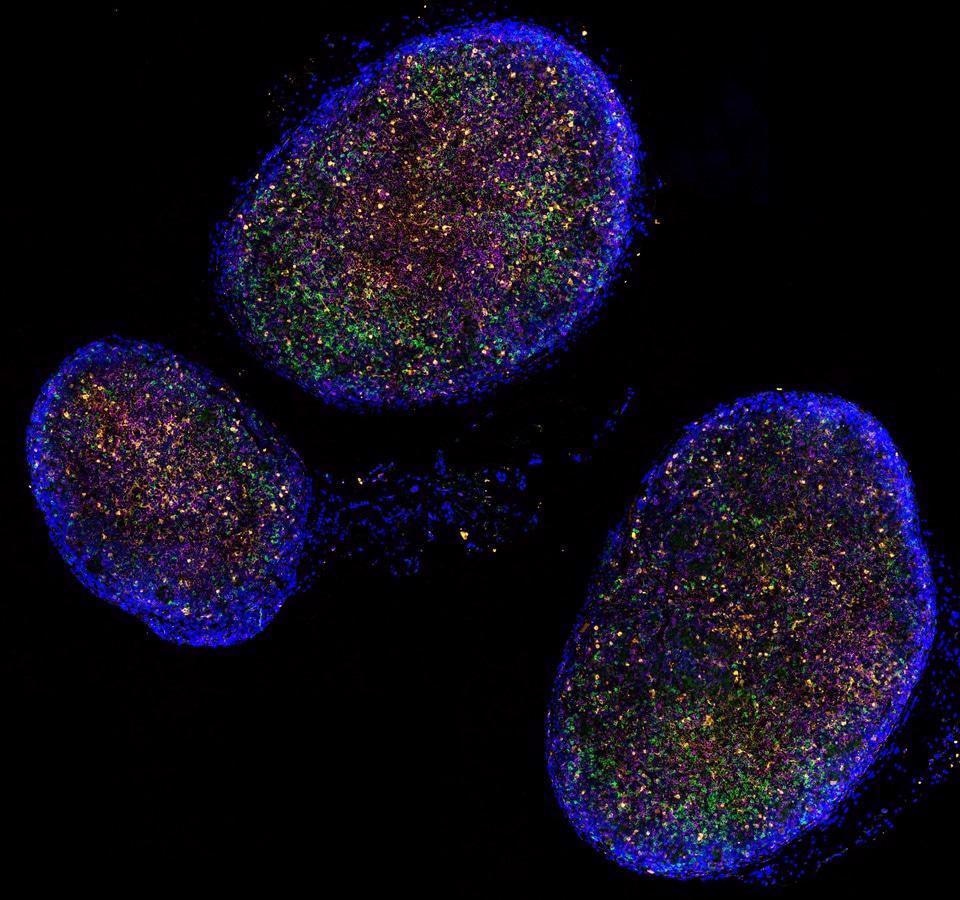
Image Credit: TissueGnostics
Are there future applications you envision for addressing cell identity and cellular interactions in diseased tissues?
When looking at cell markers, we are typically addressing plasma membrane surface or intracellular proteins in the cytoplasm, which can include transcription factors and their impact on cell function. However, there is a significant push towards addressing at the single cell level the genetic profile of cells in tissue, and this presents additional challenges that we have been working on.
For example, we are already routinely using the TissueFAXS system as an RNAScope, enabling us to work with RNA profiling at the single cell level in tissue. This requires precise imaging of the RNA fluorescent "points" in tissue at the subcellular level.
We have even employed the TissueFAXS SQL confocal system to image fluorescently-marked individual DNA nucleotides (A, G, T and C) within cell cytoplasm. In this way, we are moving towards constructing a spatial genomic map at the single cell level using a type of iterative imaging which will permit us to profile cells genetically in situ in the context of where they are in tissue, and also in terms of the other cells they come into proximity with.
By way of acknowledgement, the software development team at TissueGnostics has been consistently and extremely helpful in providing assistance with software and applications development, so as to permit us to tailor our analysis needs to the research goals at hand, and we are constantly moving forward with such goals to resolve cellular dynamics in tissue. 
About Dr. Thomas Diefenbach
Dr. Diefenbach received his PhD in neuroscience from the University of Alberta, in Alberta, Canada, and held postdoctoral positions at the University of Utah Medical School, as well as at Tufts University Medical School. He has served as manager of an imaging facility at Boston Children’s Hospital as well as a Harvard Instructor of Neurology and Cardiology, and also worked at MIT in the Research Laboratory of Electronics. Dr. Diefenbach is currently a Platform Scientist and Senior Research Laboratory Manager at the Ragon Institute of MGH, MIT and Harvard.
About TissueGnostics
TissueGnostics (TG) is an Austrian company focusing on integrated solutions for high content and/or high throughput scanning and analysis of biomedical, veterinary, natural sciences and technical microscopy samples.
TG was founded by scientists from the Vienna University Hospital (AKH) in 2003. It is now a globally active company with subsidiaries in the EU, the USA and China and customers in 28 countries.
TG systems offer integrated workflows, i.e. scan and analysis, for digital slides or images of tissue sections, Tissue Microarrays (TMA), cell culture monolayers, smears and of other samples on slides and oversized slides, in Microtiter plates, Petri dishes and specialized sample containers.
Sponsored Content Policy: News-Medical.net publishes articles and related content that may be derived from sources where we have existing commercial relationships, provided such content adds value to the core editorial ethos of News-Medical.Net which is to educate and inform site visitors interested in medical research, science, medical devices and treatments.
Sponsored Content Policy: News-Medical.net publishes articles and related content that may be derived from sources where we have existing commercial relationships, provided such content adds value to the core editorial ethos of News-Medical.Net which is to educate and inform site visitors interested in medical research, science, medical devices and treatments.
TissueGnostics